Old Folds and Contamination
The folds published with P-NDB-UFES on Mendeley Data, measured against the links rebuilt here and set beside the new folds. They are six folds of about 627 patches each, numbered 0 to 5 here, like the new folds, although the published files count them from 1. Every number on this page comes from the published tables.
Contamination
Folds are contaminated when the same patient, picture or case has patches in more than one of them: whichever fold is held out, part of that unit is in the training folds. The links between patches, pictures and cases were not available when the original folds were made, so this is measured against the links rebuilt here. The table counts the units that have patches in more than one fold.
| Unit | Units | Split in the original folds | Split in the new folds |
|---|---|---|---|
| cases | 64 | 63 (98%) | 0 (0%) |
| case groups | 63 | 62 (98%) | 0 (0%) |
| parent pictures | 247 | 245 (99%) | 0 (0%) |
| groups of related pictures | 173 | 172 (99%) | 0 (0%) |
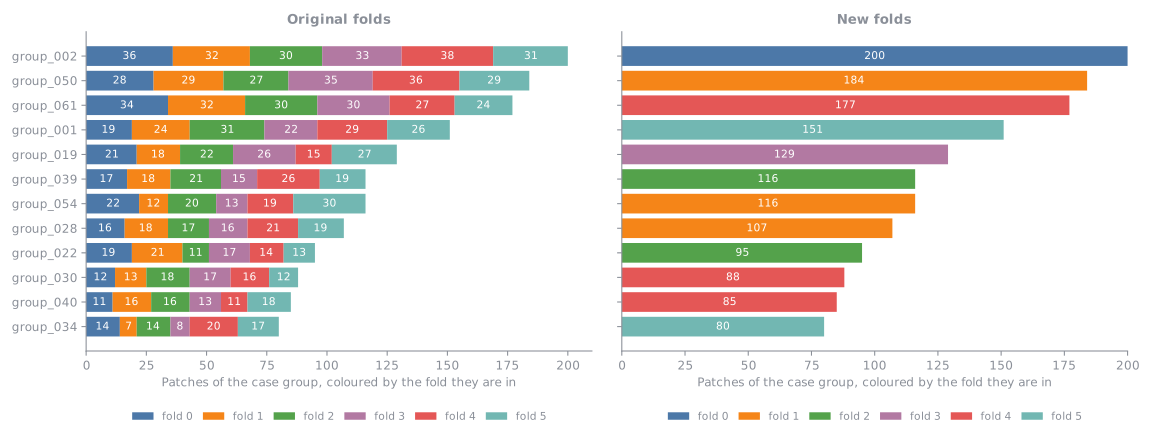
3,762 of the 3,763 patches (99.97%) belong to a case that the original folds split. The chart takes the 12 largest case groups and shows, for each, how many of its patches are in each fold. In the original folds (left) every bar is split over all six folds, so each of these patients has patches on both sides of any evaluation. In the new folds (right) every bar is a single colour.
Neighbouring patches
Patches of one picture can overlap, because they were cut next to each other. Two overlapping patches in different folds share tissue between a training fold and a test fold. The first table counts the pairs of patches of one picture that share at least the given part of their area, and how many of them are in different folds.
| Shared area | Pairs | In different folds, original folds | In different folds, new folds |
|---|---|---|---|
| at least 25% | 7,119 | 5,963 (84%) | 0 (0%) |
| at least 50% | 3,149 | 2,621 (83%) | 0 (0%) |
| at least 75% | 762 | 641 (84%) | 0 (0%) |
The second table counts patches instead of pairs: the patches that have a neighbour sharing at least that part of their area, and, among all patches, those whose neighbour is in a different fold. In the original folds, 3,563 of the 3,763 patches (95%) have a neighbour sharing at least a quarter of their area in another fold, and in the new folds none do.
| Shared area | Patches with such a neighbour | With that neighbour in a different fold, original folds | With that neighbour in a different fold, new folds |
|---|---|---|---|
| at least 25% | 3,637 (97%) | 3,563 (95%) | 0 (0%) |
| at least 50% | 3,034 (81%) | 2,767 (74%) | 0 (0%) |
| at least 75% | 1,249 (33%) | 1,076 (29%) | 0 (0%) |
An example from the data: p0020 and p0021 are cut from one picture, at (240, 719) and (486, 974), and share about 26% of their area. In the original folds they are in folds 4 and 2, so a model trained on one is tested on a neighbour that holds part of the same tissue. In the new folds they are in folds 0 and 0.
Balance
Contamination is one side. The other is whether the folds look alike. In short, the new folds are less alike than the original ones: they give up some evenness to avoid the contamination. For each value, the table gives the spread: the percentage of the fold with the highest share of that value minus the percentage of the fold with the lowest, in percentage points. For example, if 30% of the patches of one fold are OSCC and 25% of another fold's, the spread is 5 points. Small numbers mean the folds look alike.
| Value | Spread, original folds | Spread, new folds |
|---|---|---|
| patch label: Leukoplakia with dysplasia | 0.2 | 7.8 |
| patch label: Leukoplakia without dysplasia | 0.2 | 2.6 |
| patch label: OSCC | 0.2 | 7.3 |
| NDB-UFES diagnosis: Leukoplakia with dysplasia | 4.1 | 3.6 |
| NDB-UFES diagnosis: Leukoplakia without dysplasia | 3.2 | 1.8 |
| NDB-UFES diagnosis: OSCC | 5.1 | 6.4 |
| NDB-UFES diagnosis: not in NDB-UFES | 5.4 | 3.6 |
| gender: F | 5.3 | 7.9 |
| gender: M | 5.7 | 5.7 |
| gender: unknown | 5.4 | 3.6 |
| age group unknown | 5.4 | 3.6 |
| age group < 40 years | 1.6 | 9.6 |
| age group 40-60 years | 4.6 | 8.6 |
| age group > 60 years | 2.1 | 7.0 |
| morphology cluster: 0 | 4.1 | 7.8 |
| morphology cluster: 1 | 3.2 | 5.7 |
| morphology cluster: 2 | 4.1 | 3.7 |
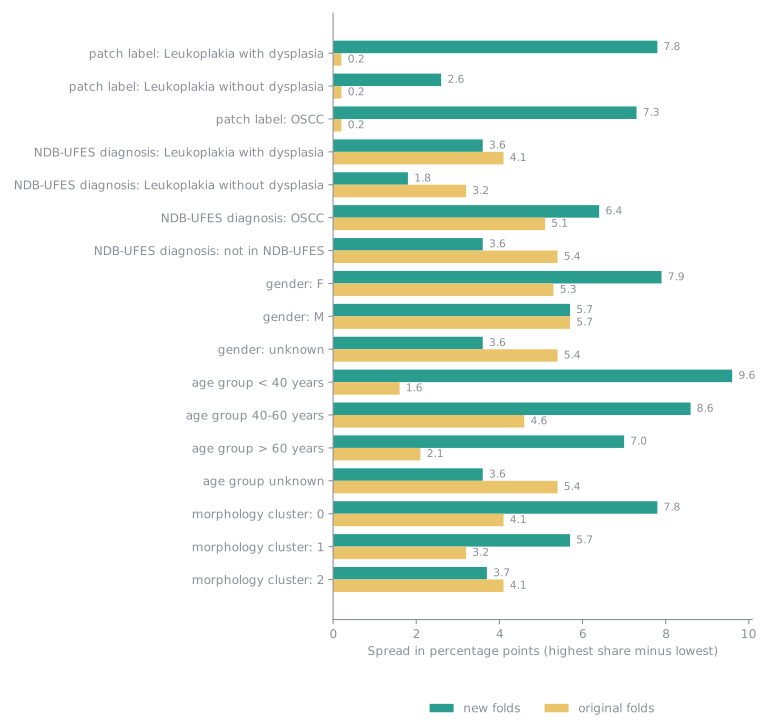
The original folds are the more even: their widest spread is 5.7 points, against 9.6 for the new folds. The new folds give up a little evenness to keep every case, picture and group of related pictures in one fold. The widest spreads in the new folds are for the smallest groups of patients, for example age group 0, which is only 199 patches in a few case groups.
The original folds and the morphology clusters
The original folds deal patches out one by one, so patches of one picture end up in different folds. How the folds divide the three morphology clusters (see New Folds for what they are):
| Fold | Cluster 0 | Cluster 1 | Cluster 2 |
|---|---|---|---|
| fold 0 | 281 (45%) | 224 (36%) | 123 (20%) |
| fold 1 | 271 (43%) | 230 (37%) | 126 (20%) |
| fold 2 | 255 (41%) | 228 (36%) | 144 (23%) |
| fold 3 | 274 (44%) | 213 (34%) | 140 (22%) |
| fold 4 | 276 (44%) | 233 (37%) | 118 (19%) |
| fold 5 | 275 (44%) | 217 (35%) | 135 (22%) |
| all folds | 1,632 (43%) | 1,345 (36%) | 786 (21%) |
Distance between the folds
The chart gives, for every two folds, how far apart they are in the plane of the first two PCA components of the patch embeddings (the picture under Morphology clusters). The distance is 0 when two folds cover the space in exactly the same way and grows the more differently they cover it. The panels are the original folds, the new folds, and a random division of the patches into six folds of the same sizes as the new folds (the average of 20 divisions), which is the distance that chance alone gives. The number in each title is the mean distance. In each panel both axes are the folds: the square where a row and a column meet is the distance between those two folds, and the diagonal is empty because a fold has no distance to itself.
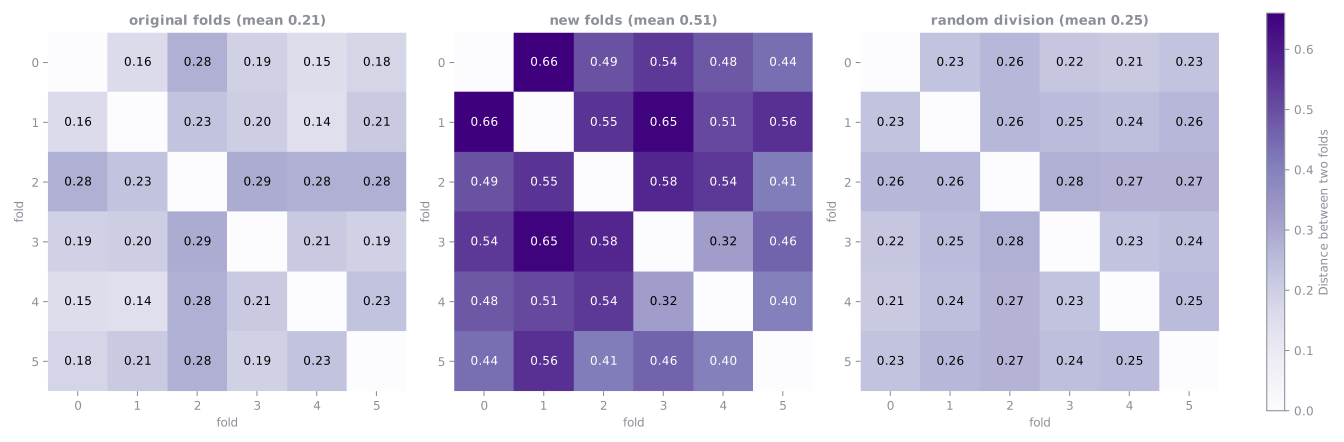
The original folds are about as close as a random division (mean 0.21 against 0.25), because they deal the patches out one by one. The new folds are about 2.1 times as far apart (mean 0.51), and the farthest are folds 0 and 1 (0.66). Patches of one case group look alike and sit close together, so keeping case groups in one fold makes each fold cover the space a little differently.
What this means
Results on the original folds are not directly comparable with results on the new folds, and scores on the original folds can be higher than they would be on new patients, because their test folds hold neighbours of their training patches. Retraining on the new folds is what will show how much the contamination mattered.